Let \chi be rv, counting of events , 0, 1, 2 … per interval. \chi might be
counts per unit time, distance.
typos per page.
cars passing per unit time.
ATM customers per hour.
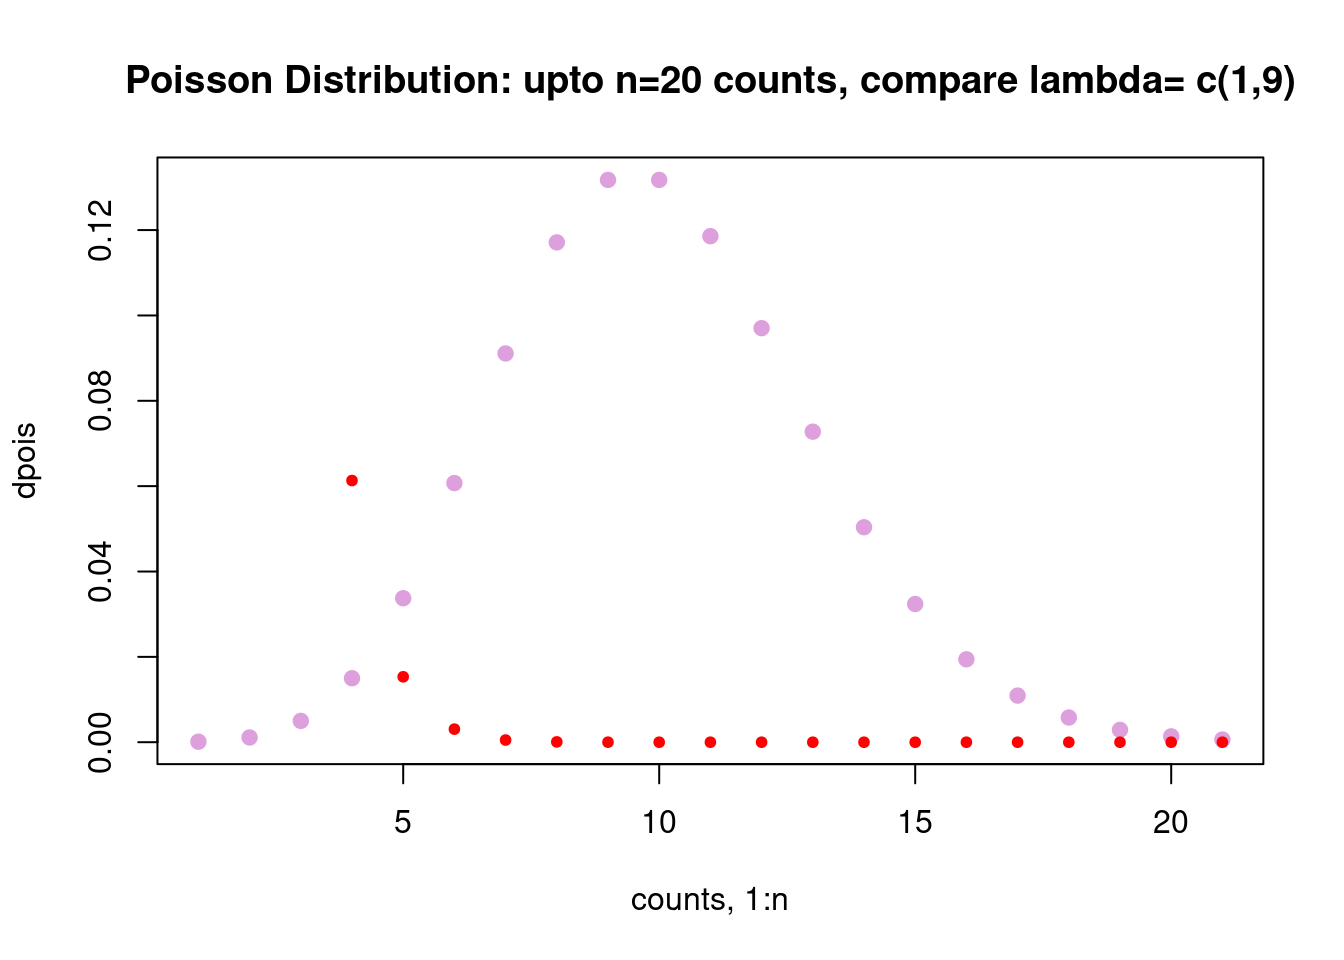
Motivating Poisson:
Suppose, on average, receive 9 letters in mail each day. And suppose can model post office as poisson. This addresses question: how many letters will I received today? Then expect sd to be sqrt(9) and so expect actual number of letters to vary between 3 and 12 (2 sd).